
Geonarratives
Geonarratives are web applications that combine interactive web maps with narrative text, images, and multimedia content.
WIM utilizes ESRI’s story maps templates, which are useful in disseminating science and data in an effective, user-friendly format to educate, engage and connect with other scientists, cooperators, and the public. Create your own USGS, National Park Service, or GeoPlatform VisID compliant Geonarratives using WIM's Geonarrative Frame Generator. WIM can also assist with hosting - reach out to the contacts below for more information.
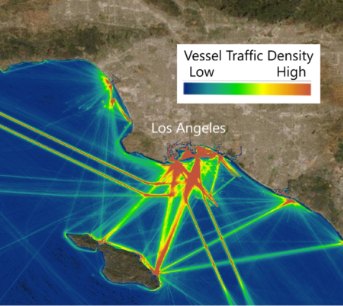
Expanding Pacific Exploration & Research
Less than 20% of the world's oceans have been explored. A global initiative seeks to change that, by pledging to complete detailed mapping of 10% of the seafloor by the year 2030.
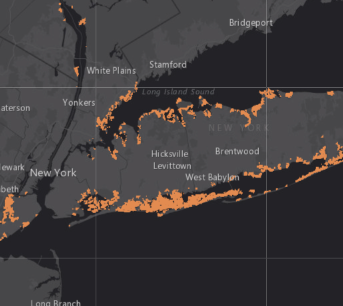
National UVVR Map
This map shows the unvegetated and vegetated area of coastal wetlands and adjacent land (inland and shorelines) for the Conterminous United States computed from 2014-2018.
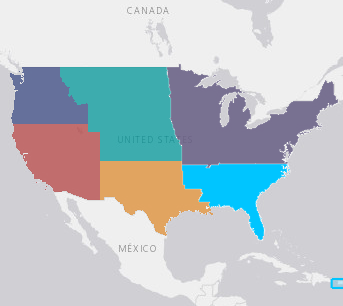
Ecological Drought Across the Country
Learn about how the Climate Adaptation Science Centers have been exploring the topic of ecological drought across the country.
You can view a longer list of USGS Geonarratives at the link below.
View More GeonarrativesWant to know more about Geonarratives?
If you think you have a project that could benefit from a geonarrative, please don't hesitate to contact us with any questions or inquiries.